QGIS 3D
Yes QGIS can make 3D map visualisations/projections. Here and there, you’ve seen those maps. Three‐dimensional maps are inevitably called beautiful. Most of what I see is tacky. Anyway, here’s not a ‘HOWTO’, because I’m no expert. Gear to help.
What kind of 3D?
There are a few kinds of 3D. For example, a map view from vertically above, but with indications of depth to the view. One indication may be contour‐lines. Another indication may be to pretend a light shines on the map, then calculate where the shadows fall.
A more drastic form of 3D indication is if the image pretends the viewer is seeing the map from the side. So now hills and mountains ‘’stick up’.
On raster data
3D needs raster data. Raster data is data that gives a set of points, rather than connected lines. In image processing that means not a line drawing, but a photo. Same idea in a map application—a grid of points. However, map raster files don’t carry colours—they carry, for terrain purposes anyway, heights/elevations.
QGIS has tools that turn vector data into raster data, and raster data into vector data. I’ve tried these tools, and had no good results. I’m sure they work, otherwise they wouldn’t be there. I suspect they are not intended for the data I used. If I find out more I’ll tell.
Words you need to know
This is a subject with it’s own words. I don’t like glossaries but,
Relief map
A map that ‘sticks out’, or ‘sticks up’
Hillshading
A technique for showing 3D by pretending a light is shining on a relief map, then showing the shadows. Hillshading can be relevant to maps viewed vertically or at an angle
DEM
Digital Elevation Model. A map made from raster data
SRTM
Shuttle Radar Topography Mission. Raster data from outer‐space scanning, mainly, obviously, a US Space Shuttle
LiDAR
Light Detection and Ranging. Raster map data from planes or satellites, gathered by (usually) laser‐light bounce
LiDAR is different from usual terrain dataset. It’s possible to gather height data by walking round with some device that measures altitude. LiDAR bounces light from high above, so measures the surface. That includes houses and trees. This can be good and bad. LiDAR data can capture a forest canopy, which may be needed for biological analysis. Also, the satellite images are growing in number. But LiDAR is not good at ground level relief, needs a lot of work to remove buildings and canopies, and tends to be delivered in very small tiles. Not good for walk‐maps.
Filetypes
This is remarkably easy, and odd. Most raster map data arrives as TIFF. TIFF is a format never/rarely used for image editing, not even by professional visual editors. It can work as a container and carry much incidental data, but that makes it heavyweight. It’s main use nowadays is for archiving—which makes it the default filetype for map raster data.
Where to get raster data
The usual problems. You’ll see some map on the web, or some pretty tutorial, think, “I’d like to try that!”, then discover there is no data for what you want to do. Or that the data is an impossible mess of open and commercial. All the while being dragged through people’s ‘easy download’ tools and misleading web information.
I’m not going to help. I’m going to illustrate the problems by describing some UK datasets,
Commercial. Don’t be fooled
Several filetypes, no rasters. 3 sets of data—contour, land/water boundary and spot‐height vector files. 1.2G download, so if you intend to try, start now. Whole UK in three files
Shapefiles, TIFF rasters. Very small 5km square tiles
ASCII or ARCGIS raster. This is a deprecated Ordnance Survey raster map concatenated into English/Scotland as one file. TIFF raster or ARCGIS thingy
TIFFs. Frequently referenced on the web. A half‐official compilation/access tool. As for the raster availability—small tiles. It doesn’t even cover the whole of the U.S. (outta luck, midwestern people)
Multiple filetypes. SRTM data available. Bewildering source compilation website. Some data needs registering and a login. Try Digital Elevation GMTED2010. Raster for Europe? Wish you well
And bear in mind this data is likely being rehashed by ‘providers’ all over the web. Right, I’m not mucking about. My needs are not deadly accurate modern maps. For examples I use the stitched/mosaic Panorama map. Don’t care if it’s 25m out, so long as it looks roughly ok and I can use a CRS to get it behind other material. If you want to follow, download, then look inside for the big TIFF file. Load into your project, or make new project.
Half‐3D Hillshade
This is useful for both vertical and angled viewpoints. The effect needs to be saved as a raster file, TIFF, and placed on a new layer. Select the raster layer, then,
Raster > Analysis > Hillshade
Put a filepath for the new tiff. The other base settings work well, so I’d keep with them to start. Other factors are more important.
The result will be a grey looking layer that dulls out your result‐image. Or if isolated looks like a dirty stain. However, zoomed in, you will see it contains strong hillside shading.
First, place the image at the top of the layer stack, because most people using this effect want a realistic effect, so the shade should apply to everything. Next change the image‐editing options to stress the image slopes as you wish. The problem I find here is that there are many ways to achieve the amount of shading I want, and it can be difficult to find the effect that makes my aim. For example, QGIS offers a layer‐transparency tool—it’s below the tab ‘symbology’. Another option is color‐ramps—QGIS help makes a fuss about this, so someone is using them. Yet another option is the image‐editing layer‐merge modes. Of them, for this use, the most notable are,
multiply
very strong detailed relief
burn
strong darkness on under a threshold. A favourite effect
soft light
Rather than stressing black, throws white against the lighter parts of the image
For my own use, I often ignore the transparency, set a simple linear colour ramp from black to transparent, then use the contrast control. Still, by changing the parameters on this layer, you can shade hillsides and other features.
A 3D View
Now we have data,
Crop/Mosaic to size
The TIFF needs to be imported into a layer, then cropped to size. Same proceedure as a vector layer. About stitching/mosaic of smaller TIFFs, I don’t know.
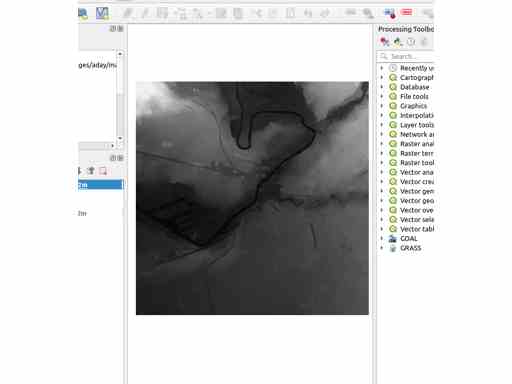
Generate a 3D view
What you have now looks grim and unpromising. The way to produce a 3D map from this data is to use a view,
View > New 3D Map View
It won’t look very 3D.
A tip: if you’ve not used docking before, QGIS Toolkit is good at docking windows. On a big screen, very nice to have the 3D view docked next to the main view. On a small screen, I find this is much too small, better to fight with dragging the floating window wider.
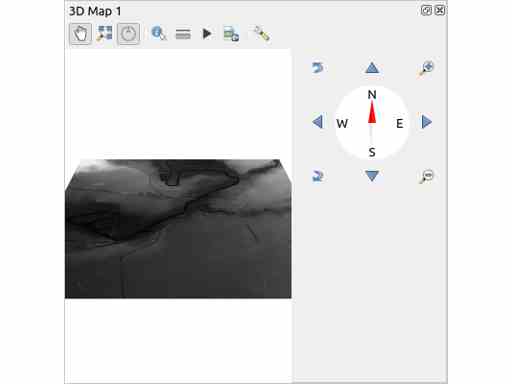
Controlling tilt
This will be tricky if you do not have,
a tutor
quiet calm computing environment
new super‐big modern screen
a mouse
but it can be done. The key is,
SHIFT‐Left‐Drag
On a touchpad, needs finger‐juggling. Then you will see the view tilt. But likely it will still look flat. Reason is, real‐world elevations not from the Andes, Rocky Mountains or moon (most examples are) are fairly low. So,
Terrain > Vertical Scale
Default is 1. Set to 10, or even 40. Now you’ll see hillsides.
Other controls
There’s a combination controller,
compass control
sets map rotation
arrow controls
pan in a direction
left corner controls
also control tilt
right corner
zoom
These are slower than using mouse gestures, so give finer control.
If the display vanishes, which can happen with the zoom and a side tilt, use the ‘Zoom Full’ button.
Useless to look at, right? Unfortunately, no direct print. Must use a map layout. With an open 3D view,
‘Project > New Print Layout’
Give the layout a name
‘Add Item > Add 3D Map’
Drag out a big box on the layout canvas
In the item properties press ‘Copy Settings from 3D View’, then select a view
Whoo! 3D view in the map layout! Print the layout as PDF, image file, whatever.
Note: layouts must be manually updated
A layout will not update automatically. If the main image is changed, to update you need to press ‘Copy Settings from 3D View’.
Further work
What we have is uninformative, some would say unpleasant. Many ways to enhance the output…
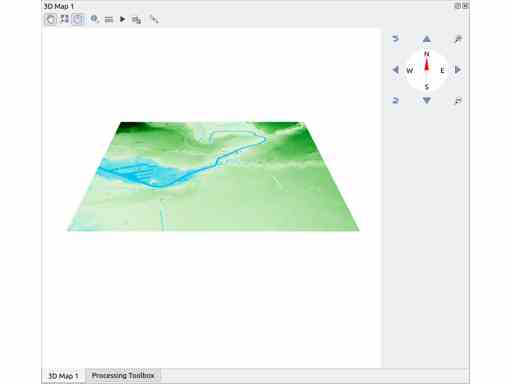
Color the slopes
In the raster layer, if you look through the ‘Properties > Symbology’ dialog, you see there is much you can do. Reverse the gradient so hilltops are colored, not bottoms. Use hillshade. Use multi‐band colors. It’s a small dialog, but big effect.
First, a white to colorized effect, then gradient,
Colorize
The default color gradient is black low, white high. Logical for default, but uninformative. To reverse, white low, black high,
(layer) Properties > Symbology > Rendering
Change to ‘White Black’, then colorize,
(layer) Properties > Symbology > Color Rendering > Colorize
Set a colour, if necessary change the brightness, then ‘OK’.
Color gradient
(layer) Properties > Symbology > Render Type
Change to ‘Singleband Pseudocolor’. The dialog will offer a color‐ramp (hopefully, the box below will offer many color‐points. If not, add some). Try loading in some color‐ramps from
(layer) Properties > Symbology > Color Ramp > All Color Ramps
Ok, you got the idea. You can customise these, modify an existing color‐ramp, or create from zero.
Layering other data
Any layers above the projected layer will be wrapped onto the 3D projection. This is how you mark buildings, woodland and so forth. If pushed too far, at low angles, this can look silly. The overlays are not 3D, so the image can gain weird effects like flattened cities and vertical lakes. But overlaying map data can add much useful information.
Warning: if you layer vector data onto a raster map, you will be using data from different sources. You may need to be check, or correct, CRS for the project and different layers.
Labels
Labels can be rendered onto a 3D map, but it’s not obvious how. The ‘style’ dialogs in 3D view will not make them appear. First, they need to be switched on. In a 3D view,
Configure > (bottom of dialog) Show labels
If you want to use map data for labels on a 3D map, be prepared to do some filtering. The labels render well, but can become a forest of 3D signposting (I often opt for a few post‐rendering image‐edited labels).
3D view
(for QGIS 3.1 These features likely to change) Layer ‘Properties’ offers a tab ‘3D view’. As far as I know,
QGIS layer visibility control switches both renderings off
if the ‘3D View’ tab is not altered, 3D views inherit the ‘flat’ styling, perhaps using defaults
if the ‘3D View’ tab has altered settings, QGIS tries to honour these in a 3D view. But will attempt both ‘flat’ and ‘3D’ renders. It may be better to change ‘flat’ render settings to ‘no symbol’
In some cases, ‘3D View’ offers advanced settings, particularly how to ask an object to track terrain, and how to react to light
if ‘Show labels’ is not on, QGIS can only render labels as funny little cube/sphere markers
In other words, this seems to be a work in progress. It’s worth checking what is available here, as it may refine the image. But not too much time—doubled images are annoying, and label/text rendering can be a fight.
‘Burning’ and other overlays
QGIS has a wide range of image processing tools. Perhaps not a match for a dedicated editor but, my opinion, presented as well as they could be. There is a transparency option on layers—it’s below the ‘symbology’ tab. In particular, there is the possibility to not manage layers as simple overlays, but to merge them with layer‐adapting processes like ‘burning in’, ‘overlay’ and so forth. This is the place to add a hillshade, then ‘burn’ into the lower layers.
Personally, I’d be careful with this, because there are may ways to achieve effects. You could forget how you achieved an effect—was it by color points, transparent ramps, overall transparency, overlay modes? You may end with an unmanageable configuration. But if you are confident with these effects, they’re waiting for you.
Post‐editing
As noted in the general article about QGIS output, there is a time to bail out of QGIS. I can’t fault the app for it’s integration of substantial image‐editing ability, but if you only need to crop or add a border, it’s time for another app.
Last thought
Most people who are not presenting scientific results seem to aim for 3D maps with a kind of realism. Perhaps because the maps are a little too obviously ‘modelled’? And the detail is spectacular, so no need to do otherwise? But you could branch…
Refs
Too brief QGIS help on raster data,
https://docs.qgis.org/3.22/en/docs/training_manual/rasters/data_manipulation.html
Tutorial, with some connection to QGIS source, will not help with the real thing,
https://www.qgistutorials.com/en/docs/working_with_terrain.html
May get you moving,
Proper detail on hillshading,
More communicative QGIS tutorial,
https://ieqgis.com/2017/09/02/adding-esris-world-hillshade-layer-to-qgis/
Advert alert, but good tutorial on using 3D view,