QGIS LIDAR data
LIDAR stands for ’laser imaging, detection, and ranging’. There’s much to the technology, but main point is all you need—bounce a laser off of something, the distance can be measured accurately. Very accurately, laser‐bouncing is one of the most accurate, optimal types of technology that exist.
More on LIDAR
Good and bad of LIDAR
Laser‐bouncing can work from a great distance, for example, from a satellite to earth. One of the first major demonstrations, Wikipedia reports, was mapping the surface of the moon. Less obviously, laser‐bouncing can trace effects it would be difficult to otherwise map, such as cloud effects. And it will work in places that are less obvious, such as mapping a seabed.
Laser‐bouncing has limitations. It can only go where light can bounce. Yes, it can work undersea, where humans can not see visibly, but it will not work through solid objects. So a LIDAR scan of the earth’s surface from a satellite may be very accurate, but reproduces the visible canopy of what can be seen. A scan of a forest maps the tops of the trees. Which may be of huge use to a biologist or environmental scientist, but of little use for a conventional ground map—‐they need to track the ground level, not vegetation levels, building heights and whatever else is visible.
As an idea, this should be refined. Laser‐bounce data may not be able to see through solid objects, but it can see through semi‐solid objects like trees, or translucent objects like the sea. LIDAR data forms allow to take advantage of this, by trying several bounces at the or near the same spot, or of different lasar intensities. Outside of research or the business of LIDAR gathering, you are unlikely to come across this much. You’ll just be hoping for some prepared and well‐annotated LiDAR files. But worth noting that raw LIDAR data may well be cluttered with inconsistencies and packed with multilevel data.
In practice, since LIDAR is highly accurate across vast areas, sometimes the data is used to track ground level. First, the ’last bounce‘ from semi‐transparent areas is likely ground level. Then, if readings over even urban areas are bottomed out and filtered, the result is likely a good guess at what the ground level would be.
Important acronym time
DTM Digital Terrain Model
Trees and buildings stripped out. an attempt at ground‐level mapping
DSM Digital Surface Model
‘As seen by the eye/laser’ data. The canopy
LIDAR Datatypes
LIDAR data can come in ‘las’ files, described as a ‘point cloud’. It can also come as TIFF image files. TIFF files have the advantage they can carry information supplementary to the data, so will often, for example, contain coordinate information. So software can move the TIFF images into place automatically. PNG or ASCII files are also used.
Right, that’s more than enough on what LIDAR is.
LIDAR and QGIS
LIDAR data that would be used in QGIS is mostly accurate elevations of landscape canopy. This LIDAR elevation data is used to produce 3D projections or models. I should say that this is not the only kind of LIDAR data available, and that QGIS is not only about use of elevations, but this is mainly what people are interested in and talking about.
QGIS (and other software) handling of LIDAR data
At the time of writing (2023), QGIS can import raw LIDAR data. Previously, raw LIDAR data needed to be converted into another form of Digital Elevation Model, a DEM. Many tutorials on QGIS and LIDAR data are steps towards creating a DEM model. Which can be tedious reading, and is not now relevant. And, as you will find, LIDAR data is nowadays available in many forms, so you can pick forms that are easy to use.
There are other programs that handle LIDAR data. Mostly these are for specialised information, or fancy viewing. I don’t think anyone reading this will be interested, but I mention them.
LAStools
LAStools is a software library for handling LIDAR data. There is a full QGIS plugin available. This is part of the main QGIS plugin repository, so can be loaded using the outstanding and self‐contained QGIS plugin manager. Then the tools can be accessed,
Processing > Toolbox > LAStools
A large list.
From web evidence, it seems the original purpose, and for sure the main original usage, of LAStools was to convert LIDAR data to QGIS‐usable forms. As noted above, QGIS now handles most forms of LIDAR data natively. However, there is still purpose for LAStools. If you find a need to go to work on LIDAR data, for example to filter points, reduce point resolution, classify or validate point data, this is the tool. So LAStools now has less of common, more of academic/research interest. But, as always, worth noting.
Getting LIDAR data
As usual in mapping, this can be dispiriting. Many resources of LIDAR mapping have been made available for free, but what you will find and how to get it is a mess of provision, layered with helpful interfaces and a lack of general information.
English Enviromental Agency Data
I’m blunt—I live in England and the government’s Environmental Agency have made LIDAR scans available. Not for the whole UK, Scotland has it’s own agency. Because I know this, I’d skip any general web provision or service provision and go straight to this source.
Even then, the situation is not simple. There are scans from various times, at various accuracies. There is more one interface—this is so users can source scans from particular times and so forth. I’d suggest this interface, which lets you download whatever is available for an area, heedless of date etc. This interface is smart, allows the use of freehand shapes or a ShapeFile for defining which tiles you need.
Even then, you may be pulled short. You’ll be offered a range of data types,
DTM vs DSM
as explained above, data processd for ground‐level, vs. detailed surface data
Composite
Mentions found suggest the idea is to give best coverage by mushing together best‐available scans
National programme
Not a clue. The data seems to be more recent than the data titled ‘Tiles’
First return/last return DSMs
First return is the top level (canopy) vs. last return the lowest‐level reflection (likely near‐ground)
Point cloud
likely raw LIDAR data, not prepared and assembled TIFF, but not tried
And so on. On a likely well‐covered area, I’ve tried,
Composite DTM
Supposed to be best‐of terrain plot. It will flatten a city, for example, no building detail, but will pick up a small river valley. Possibly the best general‐purpose LIDAR tile, as represented by it’s place at the top of the list
National First Return
for sure has a use a use in data analysis, and likely in country areas for analysis of ground cover. In urban areas it can return zig‐zag levels, like choppy water—likely because there are potential obstructions in the way, like powerlines, birds..?
National DSM
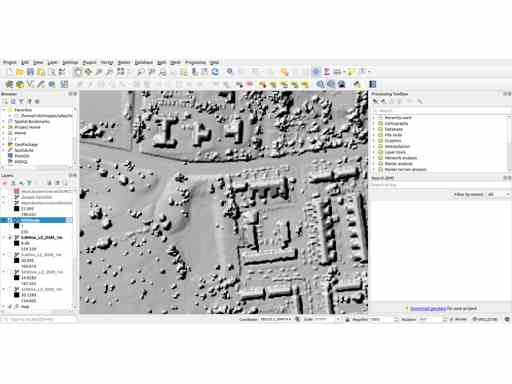
Offered me 1m 2020. Markedly better than ‘National First Return’ in urban areas, can see relief in a building, less oddities. Trees and buildings seem to gather some shape—and should be accurate for height rendering
Unless you know otherwise, for ground‐level, start with Composite DTM.
That’s not the end. The LIDAR data from this source is available in 5km tiles. Try to cover say ten or twenty square miles, and you’ll be downloading many high density LIDAR files, which will download bomb so may spray tabs across browsers and deluge your ‘Download’ folder. If you don’t have good download speeds, this could take an hour or more to complete. If you get the packages you wanted. Then you’ll need to extract the packages.
Lets say you’ve got there…
LIDAR data promises little to start. And is often unrecognisable.
Handling LIDAR in QGIS
A Map
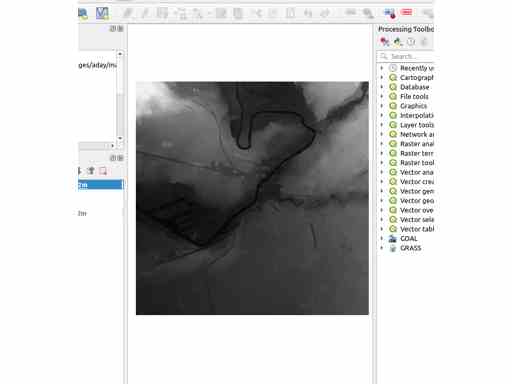
Much as the LIDAR data may seem the main event for this exercise, it can be remarkably difficult to make out where LIDAR data is located. As default, the data is patchily and generically coloured, and emphasises canopy features such as ground dips, not roads or buildings.
So it helps to add a conventional map of the area you would like to cover. Ways to add a map,
A map you made/clipped earlier, or maybe intend to modify/source for the final display
Use a ‘baselayer’ from an online source
I note that most online tutorials start, or assume, a conventional land map.
LIDAR Data into QGIS
Drag and drop a TIFF file onto QGIS. Simple. The location information/geometry in a TIFF should put the tile in the right place.
Merging
If you use multiple LIDAR files, they need to be merged. Sure, simple displays may work without. But you’ll never be able to operate on the LIDAR data, for example make a hillshade, calculate other layers, or make a 3D projection, without merging.
The most direct way is,
Raster > Miscellaneous > Merge
This tool reputedly needed to use files targetted from the ‘Input’ field. But I’ve recently successfully targeted layers. The layers are presumably used as reference to the files themselves. The tool can baulk at inconsistent data tiles and the like, in which case a flat TIFF is generated. Which is annoying. Check the tool output and other logs. Though offered by API consistency, batch merges don’t seem to offer much.
This StackExchange post suggests a ‘Translate’ method from the processing toolbox. This may be a different tool to the one listed above. The instructions mention compression, which is potentially valuable because four LIDAR tiles can be 1G of data. However, use of the tool seems to be more awkward, as it needs layer parameters changing. I’ve not tried it.
What to do with the data?
Now here we get into a mire. People are using the data for very different purposes, all pursuing their own lines. Here are some examples,
Producing contours
Several tutorials talk about generating contours from LIDAR data. To me, not promising? Yes, the data will be fabulously detailed and reasonably accurate. But a fabulously detailed contour line is not what anyone wants to look at. And one LIDAR bounce from a tree branch could throw the line out. Unless a small area, like less than half a mile, I’d look at available groundmaps. Anyway,
Raster > Extraction > Contours
Comparison of LIDAR and other datas
Such as ‘groundlevel’ DTM and surface level DSM LIDAR scans. This can be interesting in many ways. A simple comparison will give the height of the canopy, so you could tell a rough height for buildings or vegetation… if you can be bothered with working out how to generate the new layer of data. Similarly, it may be possible, with more complex calculations, to identify kinds of ground cover. There’s no doubt that, at the time of writing, this is an area of fertile academic activity.
Elevation color ramping
Use colours to make texture of the elevation data. Many people give examples of this on the web. That said, while it makes for pretty images, I’m not sure who is asking for these images, or where they are being used.
Hillshading
Well, yes, of course, and a hillshade can be burned into a map to give some relief. Or it may illustrate how much information is there, even in a wide national LIDAR scan,
There’s two ways to generate hillshades. One is to apply the hillshade colouring directly to the LIDAR layer, which gives fly‐adjustment of values like lighting direction. The other is to generate a new ‘hillshade’ layer,
Raster > Analysis > Hillshade
The layer has a preset lighting direction, which can not be later modified. But the new layer leaves the source layer unmodified, and has all the visual adjustment options of a layer, so is versatile in other ways.
Draping the data like a 3D model
This is going to be rough, not exactly modern gaming model and texture handling. But you can place a map over the top of the LIDAR data and yes, QGIS can make a 3D view of this. You could also drape matching aerial photography over the LIDAR data, which will give a 3D model of an area. If zoomed in, this will be crazed, stretching of pixels down sides is like a smear—‐tall buildings especially can be unrecognizable.
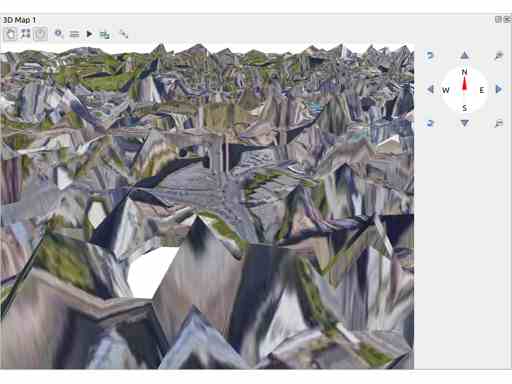
A note. Much of the weird effect here is not due to a lack of detail in LIDAR data. It is due to 3D map projections set at a conservative low resolution of 16px. Raise the resolution to 128px, and skyscrapers look like boxes, not pyramids. 245px will squeeze detail out. Big numbers will crash QGIS.
Another way to look at this—you are handling a huge amount of data here. If you only want to model a building, or an archaeological site, cut your map/photography/elevation data (LIDAR) down to the site only. That will let you raise the 3D view resolution. If you want to work over a large area, greater than a mile, accept that the result can not be zoomed.
Architects/box models
Have you noticed some web posts, sometimes noting architectural aims, that use LIDAR data to create very neat maps illustrating building layouts? Given what I’ve said above, how have they done this? The way is either to use a calculation on the LIDAR data, or to use a standard groundmap, to derive 2D building outlines. Then a calculation is made on the LIDAR data to calculate building heights. The two layers are combined, so the building outlines are pushed up the appropriate height by the height measurements. This combination can be done in QGIS, I think, but also in a 3D modelling software like Blender. Look closely at these images, every building has a flat roof, even cathedrals or monuments. Sill, it looks tidy…
Publishing 3D models to the web
The QGIS plugin ‘qgis2threejs’ can generate 3D models that can be shown on the web, complete with Javascript controls for rotation, zooming etc. While this is pretty, and quite stunning that a web‐browser can handle a display so detailed and sophisticated, most of the work seems to be as demonstration, without purpose. A friend of mine has, from a different direction, shown me work by academics and charities where these kinds of models are part of work on measuring bio‐diverity and archiving the natural environment. So there are possibilities.
Using the data to print a 3D plastic model
A possibility that has emerged in the last few years. The plugin ‘qgis2threejs’, mentioned above, can generate 3D models. Aside from it’s ability to create 3D models for the web, the models can be output in formats used for 3D printing. Models may need extra work in some software like Blender, to create a model that meets print requirements such as a base layer, no holes or undercuts, etc. About this, there are several articles and tutorials on the web.
Refs
Wikipedia,
ArcGIS (a commercial equivalent of QGIS) article on the structure of LIDAR data. Short article, excellent, recommended,
https://pro.arcgis.com/en/pro-app/latest/help/data/las-dataset/what-is-lidar-.htm
QGIS now handles LIDAR data formats natively,
https://gis.stackexchange.com/questions/19338/viewing-lidar-data-las-in-qgis
I’m never keen on video tutorials, but this is someone experimenting in overview, which is helpful. Long, and if you need info on sources and solutions, not much help,
Short, modern walk‐through of some LAStools, with some useful talk about raw LIDAR data,
https://www.geodose.com/2020/01/tutorial-lidar-data-processing-lastools-qgis.html
Tidy LIDAR/hillshading tutorial. When working with LIDAR data, hillshading is often what people are aiming at, or a helpful step,
https://www.geodose.com/2020/02/how-to-make-beautiful-hillshading-map-qgis.html
A post that exposes some of the creative possibilities. By far the most inspriring, but many unexplained steps,
Far out of date, but good info about free LIDAR UK tiles. Some scope on the issues, though no info about what may do with them,
https://historicengland.org.uk/content/docs/research/using-ea-lidar-data-pdf/